The list in numbers
A market map naming every one of the 173 companies on this list, and five breakdowns of them. They describe the list, not the market: the catalog is curated and keeps only companies that are still alive, so none of these charts is a market trend. Curated, alive-only, not exhaustive.
As of 2026-10-26
Charts and CSVs are CC BY 4.0: reuse them with credit to Security Startups (securitystartups.com) and a link. Company descriptions are not licensed.
Security startups market map
n = 173 · 13 categories · every listed company named · As of 2026-10-26
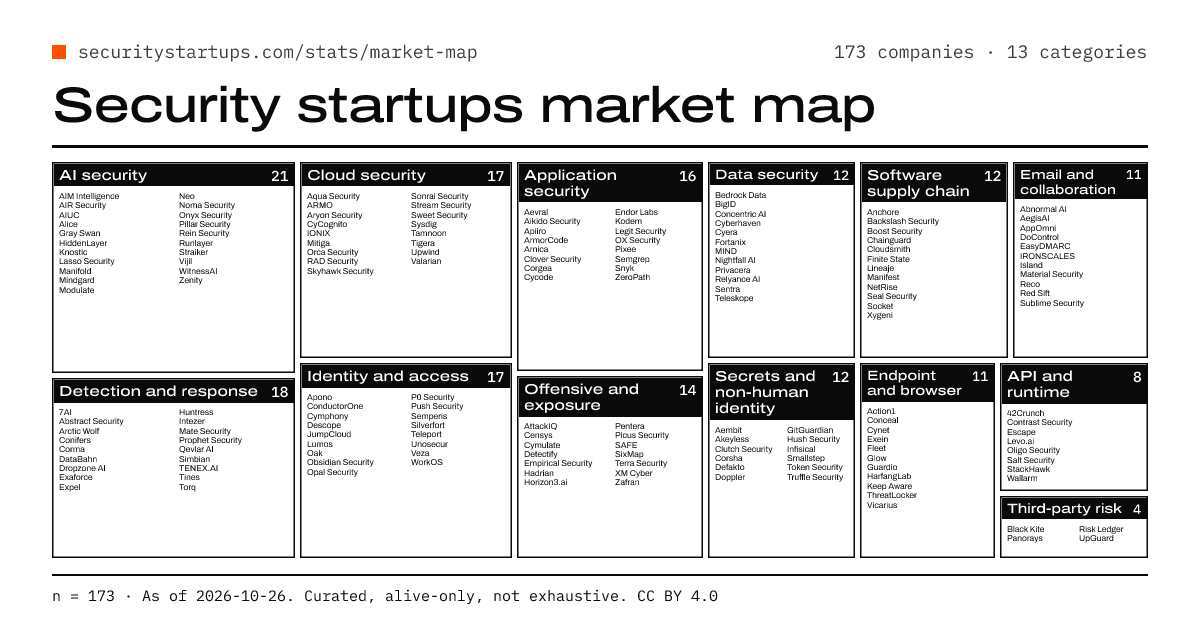
Every listed company on one map, by name. Open the map or download it (PNG). Curated, alive-only, not exhaustive.
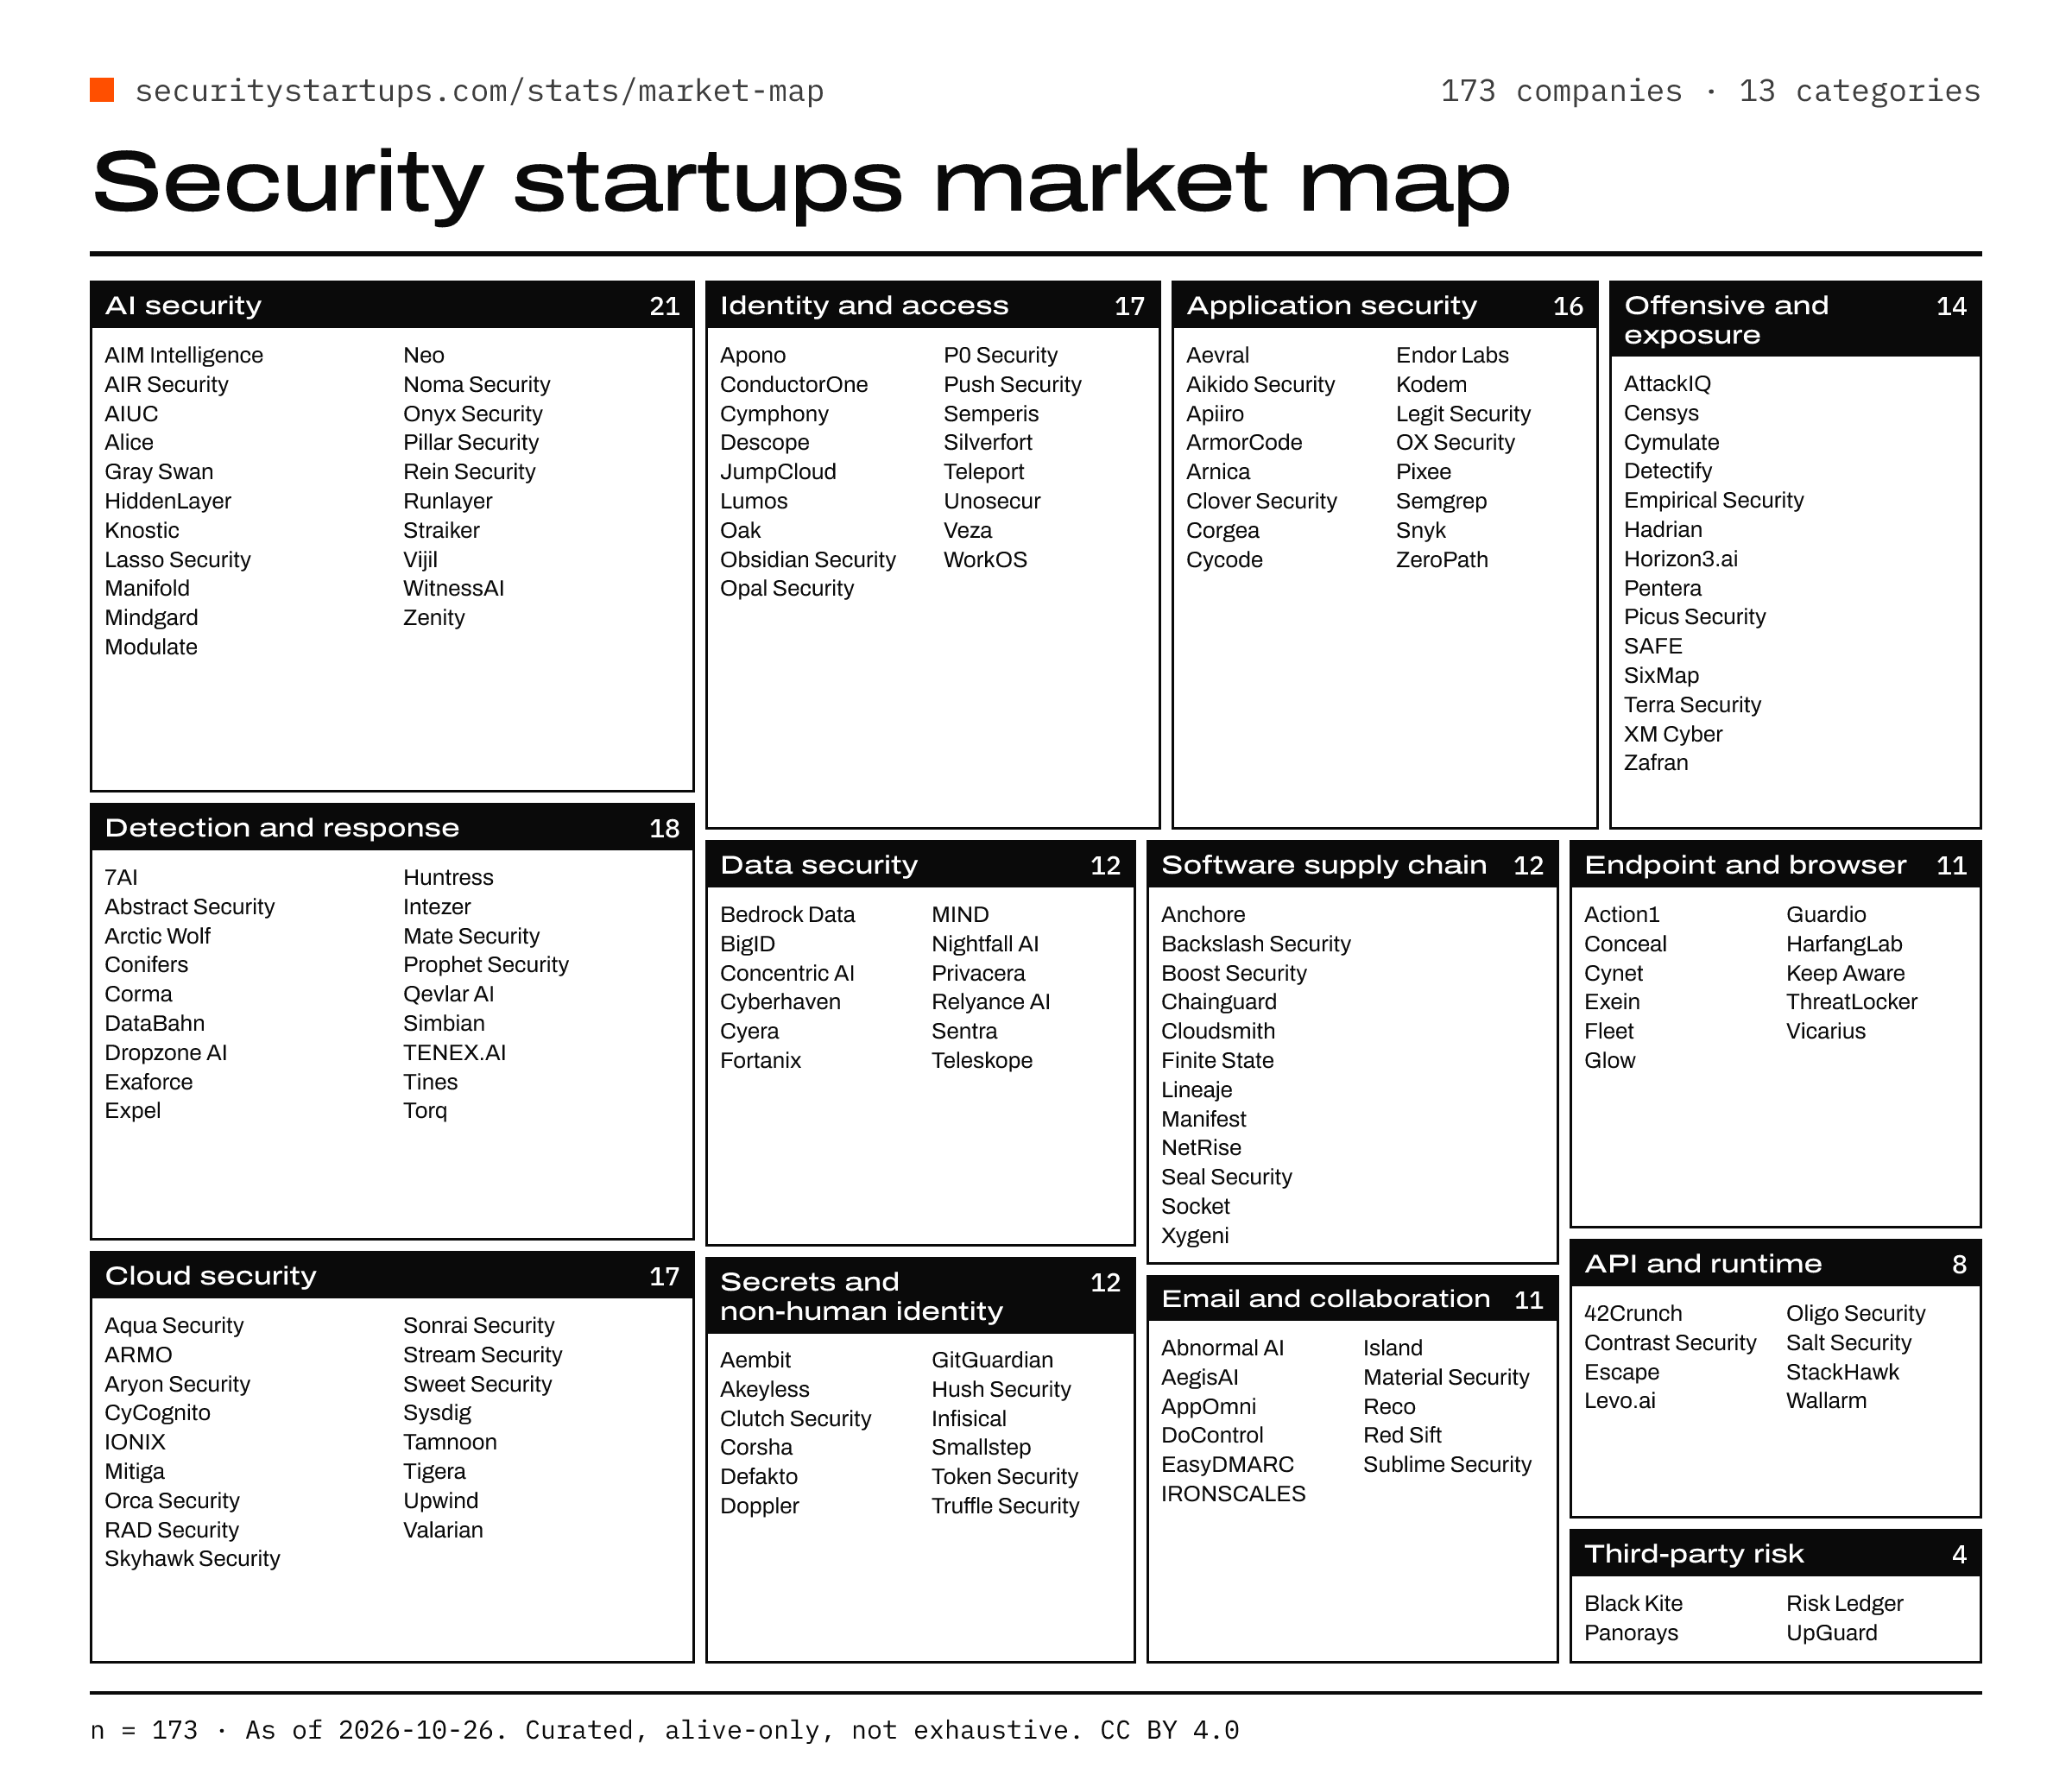
Companies by category, of listed companies
n = 173173 of 173 have a categoryAs of 2026-10-26
Of listed companies. Curated, alive-only, not exhaustive.
Method: Each company counts once, in the one primary category we assign by what it builds.
CC BY 4.0, credit Security Startups (securitystartups.com) with a link. Chart page · CSV
Numbers as a table
| Category | Companies |
|---|---|
| AI security | 21 |
| Detection and response | 18 |
| Cloud security | 17 |
| Identity and access | 17 |
| Application security | 16 |
| Offensive and exposure | 14 |
| Data security | 12 |
| Secrets and non-human identity | 12 |
| Software supply chain | 12 |
| Email and collaboration | 11 |
| Endpoint and browser | 11 |
| API and runtime | 8 |
| Third-party risk | 4 |
Funding stage mix, of listed companies
n = 173165 of 173 have a disclosed stage; 8 shown as UndisclosedAs of 2026-10-26
Of listed companies. Curated, alive-only, not exhaustive.
Method: Latest disclosed funding stage per company, as recorded in the catalog. Empty stage is shown as Undisclosed.
CC BY 4.0, credit Security Startups (securitystartups.com) with a link. Chart page · CSV
Numbers as a table
| Stage | Companies |
|---|---|
| Bootstrapped | 1 |
| Seed | 21 |
| Series A | 46 |
| Series B | 48 |
| Series C | 23 |
| Series D | 14 |
| Series E | 5 |
| Series F | 3 |
| Series G | 3 |
| Growth | 1 |
| Undisclosed | 8 |
Where listed companies are headquartered
n = 173173 of 173 have a headquarters countryAs of 2026-10-26
Of listed companies. Curated, alive-only, not exhaustive.
Method: Headquarters country as recorded, with "USA" and "United States" counted as one. Countries outside the top 8 (ties kept together) are grouped as Other.
CC BY 4.0, credit Security Startups (securitystartups.com) with a link. Chart page · CSV
Numbers as a table
| Country | Companies |
|---|---|
| United States | 123 |
| Israel | 29 |
| France | 5 |
| United Kingdom | 5 |
| Ireland | 2 |
| Australia | 1 |
| Belgium | 1 |
| Canada | 1 |
| Germany | 1 |
| Italy | 1 |
| Netherlands | 1 |
| South Korea | 1 |
| Spain | 1 |
| Sweden | 1 |
When listed companies were founded, by category
n = 173169 of 173 have a founded year; 4 without one are not shownAs of 2026-10-26
Of listed companies. Curated, alive-only, not exhaustive. Only companies still alive are listed, so older cohorts are under-represented: this is not a market trend.
Method: One dot per company at its founded year, one row per primary category, alphabetical. The black tick marks the category median.
CC BY 4.0, credit Security Startups (securitystartups.com) with a link. Chart page · CSV
Numbers as a table
| Category | Companies with a year | Median | Earliest | Latest |
|---|---|---|---|---|
| AI security | 18 | 2023 | 2017 | 2025 |
| API and runtime | 8 | 2017.5 | 2013 | 2022 |
| Application security | 16 | 2021 | 2015 | 2026 |
| Cloud security | 17 | 2019 | 2013 | 2024 |
| Data security | 12 | 2019 | 2016 | 2023 |
| Detection and response | 18 | 2023 | 2012 | 2025 |
| Email and collaboration | 11 | 2018 | 2013 | 2025 |
| Endpoint and browser | 11 | 2018 | 2012 | 2025 |
| Identity and access | 17 | 2020 | 2012 | 2025 |
| Offensive and exposure | 13 | 2016 | 2012 | 2024 |
| Secrets and non-human identity | 12 | 2021 | 2016 | 2024 |
| Software supply chain | 12 | 2021 | 2016 | 2022 |
| Third-party risk | 4 | 2016 | 2012 | 2018 |
Minimum disclosed cumulative funding of listed companies, by category
n = 173153 of 173 (88%) have a disclosed total; 7 are lower bounds counted at their floorAs of 2026-10-26
Of listed companies. Curated, alive-only, not exhaustive.
Method: Sum of each company's latest disclosed total funding, in USD. Values like "$400M+" count at their stated floor, so every bar is a minimum. Next to each bar: companies with a figure of companies listed, and lower bounds.
CC BY 4.0, credit Security Startups (securitystartups.com) with a link. Chart page · CSV
Numbers as a table
| Category | At least (USD) | With a figure | Lower bounds |
|---|---|---|---|
| Data security | $3.43B | 12 of 12 | 3 |
| Detection and response | $3.14B | 17 of 18 | 0 |
| Cloud security | $2.97B | 17 of 17 | 0 |
| Identity and access | $2.1B | 16 of 17 | 1 |
| Email and collaboration | $2.09B | 11 of 11 | 1 |
| AI security | $1.47B | 19 of 21 | 0 |
| Offensive and exposure | $1.45B | 11 of 14 | 0 |
| Software supply chain | $1.28B | 10 of 12 | 0 |
| Endpoint and browser | $1.05B | 9 of 11 | 0 |
| Application security | $998M | 13 of 16 | 0 |
| API and runtime | $834M | 6 of 8 | 1 |
| Secrets and non-human identity | $523M | 12 of 12 | 1 |
| Third-party risk | none disclosed | 0 of 4 | 0 |